Page Graph
Below is the layout of this page using the tool described here: Websites as Graphs. That seems to be a bit of a mislabeling as it really is showing the tree structure of a single page’s HTML using a 2D node and vector graph.
 Graphical
Representation of this Site’s Home Page
That entry gives the color key as:
blue: for links (the A tag)
red: for tables (TABLE, TR and TD tags)
green: for the DIV tag
violet: for images (the IMG tag)
yellow: for forms (FORM, INPUT, TEXTAREA, SELECT and OPTION tags)
orange: for linebreaks and blockquotes (BR, P, and BLOCKQUOTE tags)
black: the HTML tag, the root node
gray: all other tags
The top cluster of branches represents the side-bar navigation links, RSS feeds, logo and breadcrumb menu. The bottom “bush” is the main body of the site itself: basically a collection of entries with embedded images and links. Most of the entries tend to be pretty basic, although some of the more complex ones are depicted extending out from the main cluster.
Presumably the cleaner the site design, the cleaner its graphical representation will appear. I’m a bit of a sucker for this sort of thing, and I’ve been meaning to attend to a few housekeeping issues, so maybe I’ll see if I can’t prune a few leaves here and there.

Ipswich River Flooding
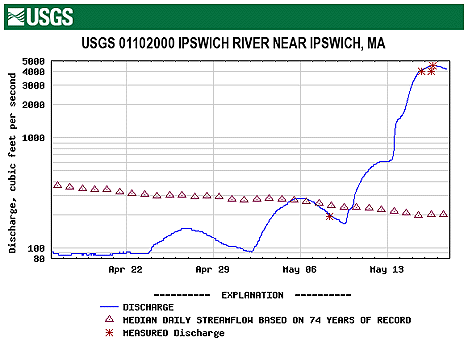
The normally placid Ipswich River in Massachusetts, which flows through the center of my home town, was turned into a roiling cauldron by the heavy rains over Mother’s Day weekend.
As this graph of the monitor run by the U.S. Geological Survey shows, the flow-rate went up during the course of the weekend to over 4500 ft3/second— which is over 20 times its normal rate for that time of year:

There is a good set of photos showing the state of the river in downtown Ipswich here.
The river was angry that day my friends. Like an old man trying to send soup back at a deli.
Update: There was a 4-alarm fire last night, June 9th, 2006, at 17 South Main Street that was hampered by the closing of the Choate Bridge.

State of the Cryosphere
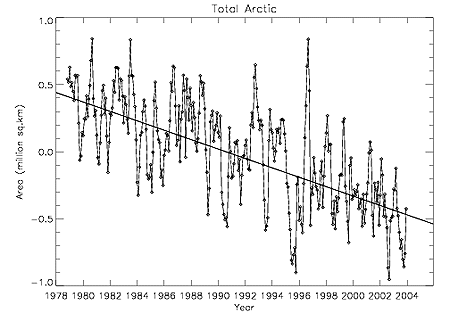
The UK Guardian reported today that the winter ice coverage in the Arctic was the lowest ever recorded—yet more evidence of the impact of global warming. The story is based on data provided by the National Snow and Ice Data Center (NSIDC) in Colorado, which hosts the original press release from last month here. This follows up another alarming report from last September.
 Arctic Ice Coverage 1978-2004
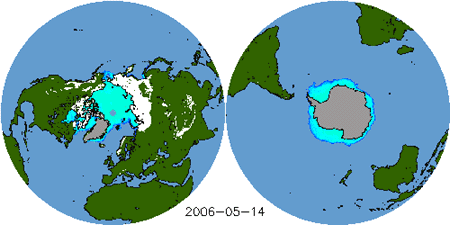
The NSIDC site contains a wealth of publicly available data, including near real-time polar ice coverage maps based on data gathered from the Defense Meteorological Satellite Program:
 Near Real-time Polar Ice Coverage Maps
Their State of the Cryosphere section contains snapshots of data on various topics including glaciers, sea ice, snow coverage, etc. It is a great source of information, but can be a bit disheartening if you cherish the arctic regions.

Nymark
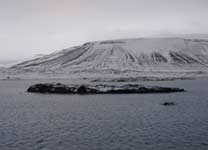
This is an internet-ready story if there ever was one. A Briton has asked Norway to grant him sovereignty over an unmapped island that he “discovered.” He wants to call the new republic “Nymark”:
In 2004, Alex Hartley from the United Kingdom discovered an unknown tiny island in the Spitsbergen archipelago. And Hartley has now asked Norway to grant him […] sovereignty over the island. “I want my island to be a republic,” Hartley told NRK.
The Norwegian newspaper Aftenposten has more details here, and features a nice, smug-faced picture of the adventurer/artist standing on his newly-claimed land.

Hartley describes the jaw-clenching tale of the island’s discovery in an entry at the Cape Farewell project’s page:
Suddenly, on rounding the southern point of Bakanbukta, the cry went out…maps were checked, the compass consulted and a small expeditionary group was hastily assembled and subsequently dispatched in the support craft.
Our small vessel headed towards the glacial edge of Sonklarbreen still unsure that our days of searching could have been so finely rewarded.
This is obviously a tounge-in-cheek stunt, but it should provide some good publicity for the project’s upcoming show at London’s Natural History Museum.

